Data-Driven Prediction Model for Component Shift in SMT Reflow Process
A machine learning study predicting component self-alignment during SMT reflow using Random Forest, SVM, and Neural Networks, achieving high accuracy in shift and rotation prediction.
Home »
Documentation »
Data-Driven Prediction Model for Component Shift in SMT Reflow Process
1. Introduction
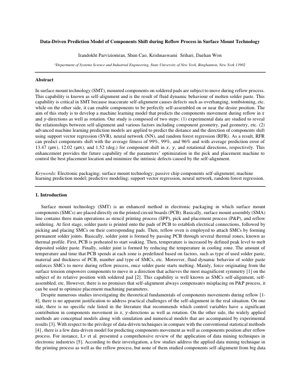
Surface Mount Technology (SMT) is a cornerstone of modern electronics manufacturing. A critical, yet unpredictable, phenomenon within the SMT reflow soldering process is component self-alignment—the movement of components on molten solder paste driven by fluid dynamics and surface tension forces. While this capability can correct minor placement errors, inaccurate self-alignment leads to defects like tombstoning and bridging. This study addresses the gap in practical, predictive understanding of this process by developing and comparing advanced machine learning models—Support Vector Regression (SVR), Neural Networks (NN), and Random Forest Regression (RFR)—to predict component shift in the x, y, and rotational ($\theta$) directions.
2. Methodology & Experimental Framework
The research followed a structured, two-step approach to bridge the gap between theoretical fluid dynamics and practical manufacturing prediction.
2.1 Data Collection & Feature Engineering
Experimental data was gathered to establish the relationship between self-alignment and key influencing factors. The feature set was meticulously engineered to include:
Process Parameters: Solder paste volume, placement offset (initial misalignment).
Target Variables: Final shift in X ($\Delta x$), Y ($\Delta y$), and rotation ($\Delta \theta$).
This data-driven approach moves beyond traditional simulation-heavy methods, as noted in reviews of data mining in electronics like that by Lv et al., which highlighted the scarcity of such applied studies.
2.2 Machine Learning Models
Three robust regression models were implemented and tuned for prediction:
Support Vector Regression (SVR): Effective in high-dimensional spaces, seeking to fit the error within a threshold $\epsilon$.
Neural Network (NN): A multi-layer perceptron designed to capture complex, non-linear relationships between input features and component movement.
Random Forest Regression (RFR): An ensemble method aggregating predictions from multiple decision trees, renowned for its accuracy and resistance to overfitting.
3. Results & Performance Analysis
X-Direction Shift
99% Fitness
Avg. Error: 13.47 µm
Y-Direction Shift
99% Fitness
Avg. Error: 12.02 µm
Rotational Shift
96% Fitness
Avg. Error: 1.52°
3.1 Prediction Accuracy Metrics
The Random Forest Regression model demonstrated superior performance across all metrics:
Model Fitness (R²): ~99% for translational shifts (X, Y), 96% for rotational shift.
These errors are significantly smaller than typical component and pad dimensions (e.g., 0402 packages are ~1000x500 µm), indicating high practical relevance.
3.2 Comparative Model Performance
RFR consistently outperformed SVR and NN. This aligns with known strengths of ensemble methods for tabular data with complex interactions, as highlighted in foundational ML literature (e.g., Breiman, 2001). The NN's potentially lower performance may stem from the relatively smaller dataset size common in physical experiments, where RFR's robustness shines.
4. Technical Analysis & Framework
4.1 Core Insight & Logical Flow
Core Insight: The "black box" of solder joint formation during reflow is not a chaotic process but a deterministic, physics-driven system that can be reverse-engineered with sufficient data. This study proves that the complex fluid dynamics and surface tension forces, traditionally modeled with computationally expensive CFD simulations, can be captured with remarkable fidelity by tree-based ensemble learning. The logical flow is elegantly simple: measure the outcome (shift), record the initial conditions (features), and let the model learn the hidden function $f$ such that $[\Delta x, \Delta y, \Delta \theta] = f(\text{geometry, paste, offset...})$. This bypasses the need to explicitly solve the Navier-Stokes equations for every component-pad combination.
4.2 Strengths & Critical Flaws
Strengths: The pragmatic, data-first approach is its greatest asset. Achieving micron-level predictive accuracy with RFR provides immediate value for process optimization. The choice of RFR was astute, as it handles non-linearity and feature interactions well without demanding the massive datasets required for deep learning.
Critical Flaws: The study's Achilles' heel is its potential lack of generalizability. The model is almost certainly trained on a specific set of components (likely passive chips), solder paste, and pad finishes. Would it predict accurately for a QFN package or with a no-clean vs. water-soluble flux? Like many ML models, it risks being a "digital twin" of a very specific lab setup. Furthermore, while prediction is solved, causation is not. The model doesn't explain why a component moves, limiting its use for fundamental design innovation. It's a superb correlative tool but not a causative one.
4.3 Actionable Insights for Industry
1. Implement Now: EMS providers and OEMs with high-mix, high-volume SMT lines should pilot this methodology. Start by building a dataset from your own process—the ROI from reducing tombstoning and bridging defects alone justifies the effort.
2. Optimize Placement: Integrate the prediction model into the Pick & Place machine's software. Instead of aiming for the nominal pad center, the machine should aim for a "pre-compensated" location $P_{comp} = P_{nominal} - \text{predicted shift}$, effectively using the reflow process as a final, automated calibration stage.
3. Bridge the Physics-ML Gap: The next frontier is Hybrid AI. Use a simplified physics-based model (e.g., calculating surface tension moments) to generate synthetic training data or as a feature itself, then refine with real-world data. This, akin to how physics-informed neural networks (PINNs) operate, would address the generalizability flaw.
4.4 Analysis Framework Example (No-Code)
Scenario: A process engineer needs to reduce defects for a new 0201 capacitor assembly.
Framework Application:
1. Data Layer: For 50 boards, intentionally vary placement offset within a controlled range (e.g., ±50 µm). Record initial X, Y, $\theta$ offset, pad dimensions, and stencil aperture size.
2. Measurement Layer: Post-reflow, use Automated Optical Inspection (AOI) or precision microscopy to measure the final $\Delta x, \Delta y, \Delta \theta$.
3. Modeling Layer: Input the collected data into an RFR model (using libraries like scikit-learn). Train the model to predict shift.
4. Action Layer: The model outputs a compensation map. Feed this into the P&P machine to apply pre-compensated placement for the next 500 boards.
5. Validation: Monitor defect rates (tombstoning, shift) from the next batch to quantify improvement.
5. Future Applications & Research Directions
Closed-Loop Process Control: Integrating real-time thermal profiling data from the reflow oven with the predictive model for adaptive control.
Advanced Package Types: Extending the model to predict shift for Ball Grid Arrays (BGAs), Quad Flat No-leads (QFN), and other complex components with uneven solder force distributions.
Generative Design for Pads: Using the model as a cost function within a generative AI system to design pad geometries that maximize self-alignment correction for a given component library.
Digital Twin Integration: Embedding the trained model into a full digital twin of the SMT line for virtual process optimization and "what-if" scenario planning, reducing physical trial runs.
6. References
Parviziomran, I., Cao, S., Srihari, K., & Won, D. (Year). Data-Driven Prediction Model of Components Shift during Reflow Process in Surface Mount Technology. Journal Name, Volume(Issue), pages. (Source PDF)
Lv, C., et al. (Year). A comprehensive review of the application of data mining techniques in electronic industries. Journal of Intelligent Manufacturing.
Breiman, L. (2001). Random Forests. Machine Learning, 45(1), 5–32.
Raissi, M., Perdikaris, P., & Karniadakis, G. E. (2019). Physics-informed neural networks: A deep learning framework for solving forward and inverse problems involving nonlinear partial differential equations. Journal of Computational Physics, 378, 686-707. (For Hybrid AI/PINNs concept)
IPC J-STD-001. (2020). Requirements for Soldered Electrical and Electronic Assemblies. IPC Association.